computed 24 Oct 2026, 23:03 MYT · every card targets one group of Malaysians · how we work
Independent analysis of official Malaysian open data (data.gov.my, DOSM). Computed statistics are real; card text is model-inferred from those numbers. Not financial or investment advice.
Ask the data
Type a question. The chart draws from real government monthly readings — 52 series, never invented.
source: DOSM / data.gov.my · monthly readings
Infographics
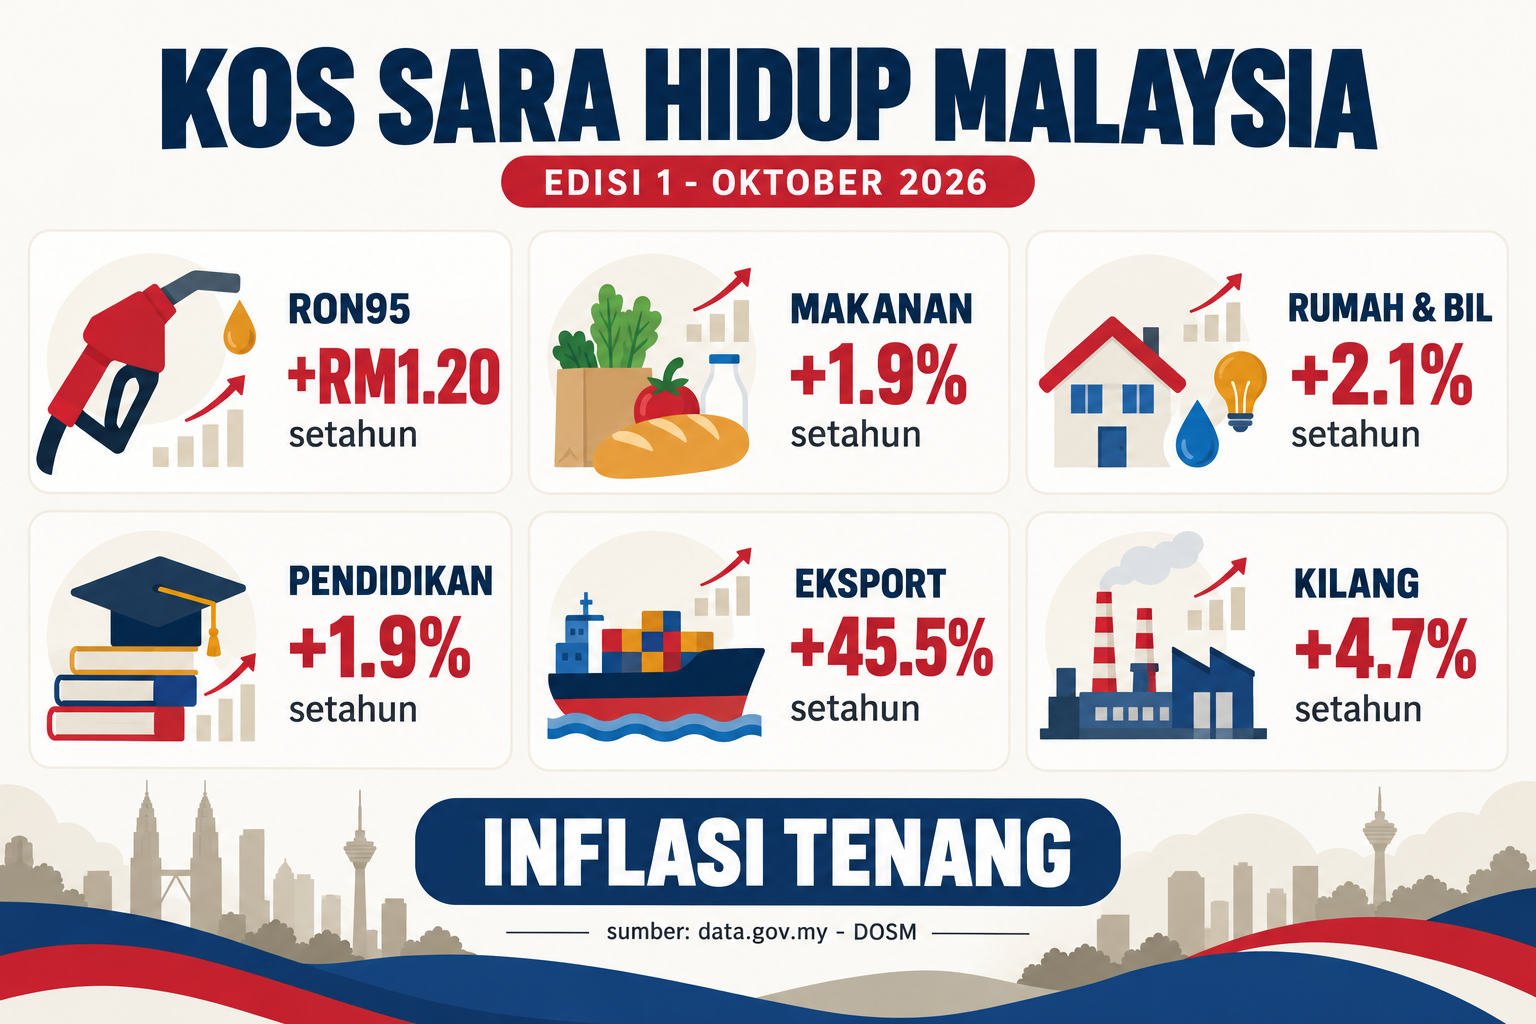
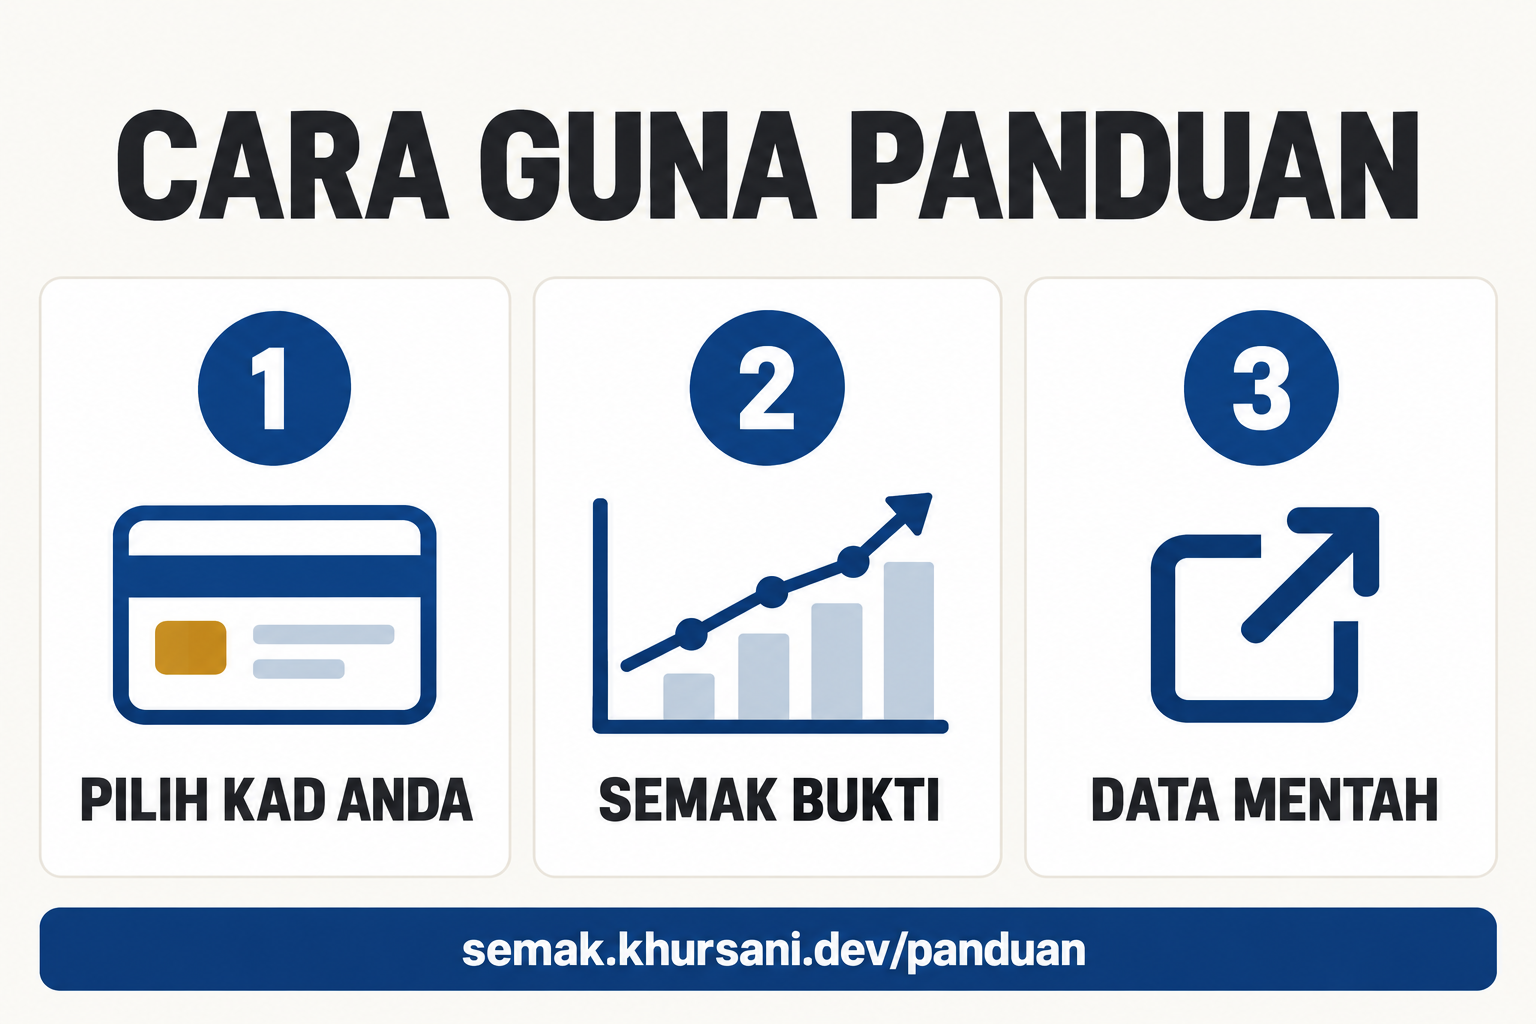
Cost of living this editionHow to use this guide
Top actions model-inferred
Drivers: The weekly review now cuts as well as raises: fill up right after the new price lands instead of the day before, and keep that habit for as long as the cuts last.
Everyone: Keep your budget on last year's shape and add a little for the year-end season: there is no broad price wave to buy ahead of.
Commuters: Expect small bus and e-hailing nudges into December: compare a monthly pass against your usual fares before the school holidays, and switch if it comes out cheaper.
new this edition
Commuters:
panel: fable
window 2024-10 → 2026-09 · range index: -0.7 – 4.1
The pump climb has reached your fare - and more small rises are coming
Computed statistics
The September count puts transport prices 2.5 percent above last year. Fares follow fuel with a lag of weeks, so small bus and e-hailing nudges are still coming.
Model-inferred interpretation
Consider: Expect small bus and e-hailing nudges into December: compare a monthly pass against your usual fares before the school holidays, and switch if it comes out cheaper.
The kitchen bill has stopped outrunning everything else
Computed statistics
Groceries rose faster than everything else for three months. September breaks the streak: food now climbs at about the same pace as the whole basket.
Model-inferred interpretation
Consider: Keep last year's market envelope and add a little for the monsoon weeks, when fresh prices usually stir: food is climbing no faster than everything else, so there is nothing to rush for.
evidence · computed
CPI food-at-home division, September release
Everyone:
panel: glm-5.3
Petrol climbed for weeks - your whole shopping basket stayed put
Computed statistics
The official September price count barely moved while the pump climbed for weeks. Fuel is only a small slice of what a household buys, so the pump alone cannot carry the whole basket.
Model-inferred interpretation
Consider: Keep your budget on last year's shape through the year-end season: there is no broad price wave to buy ahead of.
evidence · computed
September price count, all groups
Commuters:
panel: glm-5.3
The pump climb has reached your bus and e-hailing fares
Computed statistics
Fares are edging up in small steps. Fuel is the biggest cost for buses and e-hailing, and their fare sheets follow the pump weeks late.
Model-inferred interpretation
Consider: Compare a monthly pass against your usual fares before the school holidays start, and switch if it works out cheaper.
evidence · computed
transport price line + weekly pump series
Families:
panel: glm-5.3
The kitchen bill has stopped outrunning everything else
Computed statistics
Food prices now climb no faster than everything else. After months of running ahead, the eating-at-home basket matched the overall count in September.
Model-inferred interpretation
Consider: Keep last year's market money and add a little for the monsoon weeks, when fresh prices usually stir: there is nothing to rush to buy yet.
evidence · computed
food price count, September
Households:
panel: glm-5.3
Leave out food and fuel, and prices are the calmest in years
Computed statistics
Everything else barely moves month to month. This is the quietest stretch since before the 2022 wave.
Model-inferred interpretation
Consider: Quiet shelves give sellers little reason to raise prices: use this quarter to fix what you can fix, from broadband plans to instalments.
evidence · computed
core price count, ex food and fuel
Tenants:
panel: glm-5.3
Rent is the one bill still speeding up while everything else sits still
Computed statistics
The housing line - rent, water, power - is speeding up while almost everything else sits still. Rents move in steps, so the cost wave of the last two years reaches your lease about a year late.
Model-inferred interpretation
Consider: Rent resets follow price rises with a lag: settle your renewal or service-contract talk this quarter, and ask for a fixed term before the new pace sets in.
evidence · computed
housing price line, monthly
SME owners:
panel: glm-5.3
Your delivery costs move every week - your selling prices cannot
Computed statistics
The pump jumps or drops every seven days, but the prices you charge sit in the calmest stretch in years. Costs swing, selling prices stay put.
Model-inferred interpretation
Consider: Time your stock runs to the cheap weeks: check each new pump price before you plan the week's deliveries.
evidence · model-inferred
weekly pump series + core price count
updated from the last edition
Drivers:
panel: fable
window 2026-05 → 2026-10 · range RM/litre: 3.37 – 4.67
Petrol RON95 · RM/litre · latest 4.32 (2026-10) ↘ easing
Petrol finally gets cheaper - 30 sen off in a single week
Computed statistics
After five straight weekly rises, the 22 October review cut RON95 by 30 sen a litre, the biggest cut of the whole run. World crude has cooled, and the pump passes it back within weeks.
Model-inferred interpretation
Consider: The weekly review now cuts as well as raises: fill up right after the new price lands instead of the day before, and keep that habit for as long as the cuts last.
evidence · computed
weekly RON95 pump series, 22 October revision
Everyone:
panel: fable
window 2024-10 → 2026-09 · range % a year: 1.1 – 2
Consumer prices (headline) · % a year · latest 1.8 (2026-09) → stable
top of Bank Negara's 2-4% comfort band: 4% a year — now below. sustained months above this: revisit household budget lines and lock in big purchases sooner
The petrol climb never reached your whole shopping basket - September's count is proof
Computed statistics
Petrol jumped for five weeks, yet September's count shows the whole basket still rising at last year's gentle pace. The surge stayed at the pump.
Model-inferred interpretation
Consider: Keep your budget on last year's shape and add a little for the year-end season: there is no broad price wave to buy ahead of.
evidence · computed
monthly national CPI, September release
Households:
panel: fable
window 2024-10 → 2026-09 · range % a year: 1.6 – 2.3
Consumer prices (core) · % a year · latest 1.7 (2026-09) → stable
Leave out food and fuel, and prices are barely moving - the calmest stretch in years
Computed statistics
Prices outside food and fuel rose 1.7 percent over the year in September, and the pace has drifted down for months. The only noise this year has been at the pump, and even that is easing now.
Model-inferred interpretation
Consider: When quiet categories stay quiet, sellers have little reason to raise: use this quarter to lock anything fixed, from broadband plans to car instalments, before any next wave.
evidence · computed
monthly CPI core line, food and fuel excluded, September
Rent and bills are rising faster every month - the quiet year is over
Computed statistics
Rent and household bills now cost 2.1 percent more than a year ago, against about 1.2 percent earlier in the year, and the pace has quickened three months running.
Model-inferred interpretation
Consider: Rent resets follow price rises with a lag: settle your rent or service-contract talk this quarter, before the new pace sets in, and ask for a fixed term.
evidence · computed
monthly CPI housing and utilities line, September
Workers:
panel: fable
window 2024-10 → 2026-09 · range RM: 118.3b – 215.1b
Exports · RM · latest 215.1b (2026-09) ↗ rising
Factories are shipping nearly half more than last year - the chip boom is hiring here
Computed statistics
August exports reached about RM191 billion, roughly 45 percent above a year ago, and every month since March matched or beat the last. Factory output sits at its highest on record.
Model-inferred interpretation
Consider: Hiring and overtime follow shipments within weeks: if you want factory work, or you supply meals, transport or parts to factories, knock now, before the year-end rush.
evidence · computed
monthly trade release + industrial production index
Prices here woke up this year - next door in Perlis they never did
Computed statistics
A basket in this state now costs 2.2 percent more than a year ago, after a year of near-zero rises. Next door in Perlis the same basket is up just 0.6 percent, the calmest in the country.
Model-inferred interpretation
Consider: A border run pays on bulky monthly goods if Perlis is easy for you to reach: price a full trolley in both states once this month, and keep shopping at home if the saving is small.
evidence · computed
monthly state CPI series, September release
previous stories (already read)
first edition under the new layout - previous stories start next week
removed this edition
Job seekers: The newest services-share reading is still January 2025, about 21 months old with nothing added in this week's ingest, so the 'two in three jobs now' claim is stale.
What the data shows computed
Air: carbon monoxide
0.54 ppm· 12-mo +0.03 ppm
computeddata period Dec 2023
Air: nitrogen dioxide
0.01 ppm· 12-mo +0 ppm
computeddata period Dec 2024
Air: ozone
0.01 ppm· 12-mo +0 ppm
computeddata period Dec 2024
Air: PM10
18.89 µg/m³· 12-mo +1.41 µg/m³
computeddata period Dec 2024
Air: PM2.5
11.54 µg/m³· 12-mo +1.75 µg/m³
computeddata period Dec 2024
Air: sulphur dioxide
0 ppm· 12-mo +0 ppm
computeddata period Dec 2024unusual reading Jun 2024
Current account
10,766 RM million· 12-mo +2569.39 RM million
computedunusual reading Jul 2020unusual reading Oct 2022
Financial account
-26,957 RM million· 12-mo -19,498 RM million
computedunusual reading Jan 2022unusual reading Jan 2026
Capital account
-4.24 RM million· 12-mo +16.09 RM million
computed
Net errors & omissions
33,179 RM million· 12-mo +46,288 RM million
computedunusual reading Jan 2022unusual reading Jan 2024unusual reading Apr 2024
Official reserves
-16,985 RM million· 12-mo -29,375 RM million
computed
Consumer prices (core)
1.7 % a year· 12-mo -0.4 % a year
computed
CPI Division 01
1.8 index· 12-mo -0.3 index
computed
CPI Division 02
2.8 index· 12-mo +2.5 index
computed
CPI Division 03
0.2 index· 12-mo +0.4 index
computed
CPI Division 04
1.4 index· 12-mo -0.1 index
computed
CPI Division 05
0.3 index· 12-mo +0.1 index
computed
CPI Division 06
1.4 index· 12-mo +0.1 index
computed
CPI Division 07
2.5 index· 12-mo +1.8 index
computed
CPI Division 08
1.8 index· 12-mo +6.3 index
computedunusual reading May 2025unusual reading Jun 2025unusual reading Jul 2025
CPI Division 09
1.2 index· 12-mo +0.3 index
computed
CPI Division 10
2.1 index· 12-mo -0.3 index
computedunusual reading Jan 2026
CPI Division 11
2.2 index· 12-mo -1.1 index
computed
CPI Division 12
1.2 index· 12-mo -4.4 index
computedunusual reading Jan 2026unusual reading Feb 2026unusual reading Mar 2026
CPI Division 13
2.8 index· 12-mo -2 index
computedunusual reading Oct 2025unusual reading Nov 2025unusual reading Dec 2025
Consumer prices (headline)
1.8 % a year· 12-mo +0.3 % a year
computed
Cost of living (B40)
137.3 index· 12-mo +2 index
computed
CPI Inflation: Johor
2.2 index· 12-mo +0.2 index
computed
CPI Inflation: Kedah
2.2 index· 12-mo +1.3 index
computed
CPI Inflation: Kelantan
0.7 index· 12-mo +0.2 index
computed
CPI Inflation: Melaka
1.5 index· 12-mo -0.3 index
computed
CPI Inflation: Negeri Sembilan
2.4 index· 12-mo +0.5 index
computed
CPI Inflation: Pahang
2.1 index· 12-mo +0.7 index
computed
CPI Inflation: Perak
1.1 index· 12-mo +0.2 index
computed
CPI Inflation: Perlis
0.6 index· 12-mo -0.8 index
computed
CPI Inflation: Pulau Pinang
1.5 index· 12-mo +0.3 index
computed
CPI Inflation: Sabah
1.9 index· 12-mo +0.6 index
computed
CPI Inflation: Sarawak
0.5 index· 12-mo -0.1 index
computed
CPI Inflation: Selangor
1.9 index· 12-mo +0.1 index
computed
CPI Inflation: Terengganu
1.2 index· 12-mo -0.5 index
computed
CPI Inflation: W.P. Kuala Lumpur
1.8 index· 12-mo +0.5 index
computed
CPI Inflation: W.P. Labuan
2.4 index· 12-mo +1.3 index
computed
CPI Inflation: W.P. Putrajaya
2.2 index· 12-mo +1.2 index
computed
Jobs: agriculture
8.9 share %· 12-mo -4.1 share %
computed
Jobs: industry
26.1 share %· 12-mo -2.2 share %
computed
Jobs: services
65 share %· 12-mo +6.4 share %
computed
Diesel
5.07 RM/litre· 12-mo +0.45 RM/litre
computedunusual reading Sep 2026unusual reading Sep 2026unusual reading Oct 2026
Petrol RON95
4.32 RM/litre· 12-mo +0.5 RM/litre
computedunusual reading Sep 2026unusual reading Sep 2026unusual reading Oct 2026
Industrial production
148 index· 12-mo +6.99 index
computedunusual reading Jun 2026unusual reading Aug 2026
Trade balance
33.7b RM· 12-mo +13.3b RM
computedunusual reading Mar 2026unusual reading Apr 2026unusual reading May 2026
Exports
215.1b RM· 12-mo +75.9b RM
computedunusual reading Apr 2026unusual reading May 2026unusual reading Jun 2026
Imports
181.4b RM· 12-mo +62.6b RM
computedunusual reading Apr 2026unusual reading May 2026unusual reading Jun 2026
How this works
Every card starts with official data from data.gov.my (DOSM) — pulled directly through the public API, no key required.
The statistics are computed mathematically: trends, 12-month changes, anomalies, and correlations between series. Those numbers are real and checkable in each card's evidence line.
The card text is written by an AI model from the computed numbers — labelled model-inferred on every card. The statistics stay real; the interpretation is inference. Not financial advice.
Inflation carries Bank Negara's 2-4% guidance band. Unusual values are flagged. Stale data is labelled. The era's events are told as context.